Start with a raster of width w, where w is a primorial. Number the pixels starting from zero, left to right within a row, and rows from the top to bottom, like the layout of English text. Color the composites white and primes black.
Here is an example of width w = 5# = 5 * 3 * 2 = 30. ("It's raining primes!")
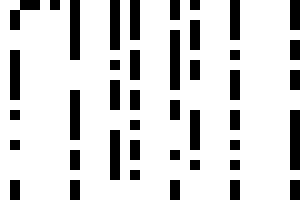 |
Some columns are always multiples of an integer so are white or mostly white. (Mostly white when they have only a single prime in first row.) For example, the columns corresponding to 30k (the leftmost column) and 30k+4 are completely white, containing no primes. The columns corresponding to 30k+2, 30k+3, and 30k+5 have only one prime each, namely 2, 3, and 5. Eliminate the white and mostly white columns and mash the remaining columns next to each other. We choose the starting width to be a primorial in order to be able to eliminate many white columns.
For our above example starting with 30 columns, 8 remain (the "remainder set") after removing white columns. The 8 columns correspond to integers of the forms 30k + {1, 7, 11, 13, 17, 19, 23, 29}.

The number of columns that remain for various primorials is OEIS A005867.
What remains? Are there patterns apparent in what remains?
Inspiration was this image, formerly used in Wikipedia (but now not).
Below is another example starting with w = 11# = 2310, leaving a remainder set of 480 columns after white columns are eliminated. There are 270 rows, chosen to make the final aspect ratio the same as HD (480/270 = 1920/1080). It's a nice coincidence that the number of columns of HD is a multiple of the remainder set size of 11 primorial. There are primepi(11# * 270) - 5 = 50878 primes (black pixels) in the picture. We subtract 5 because 2, 3, 5, 7, and 11 were in eliminated columns.
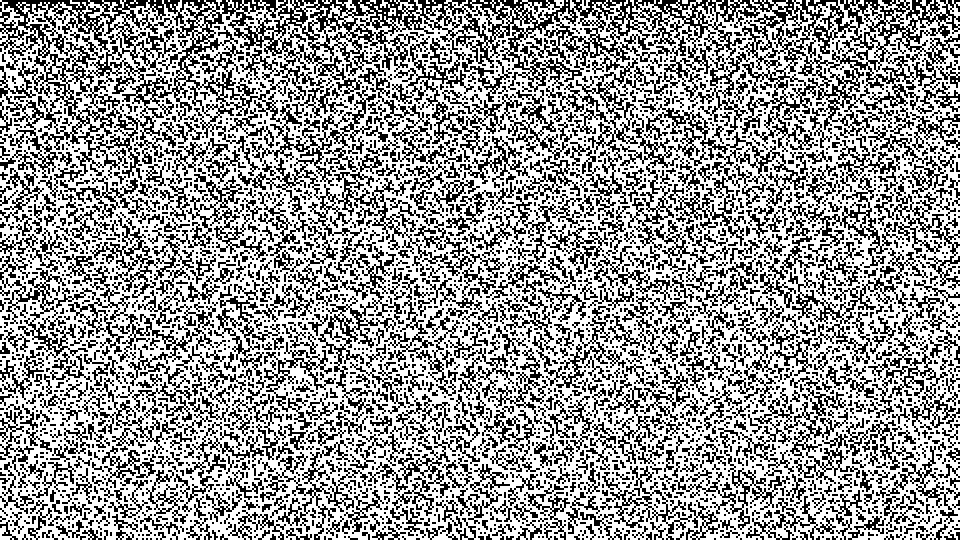
("Prime snow.")
Unlike the famous Ulam spiral, there doesn't seem to be any striking patterns or features.
I suspect questions about the clumpiness of the dots relate to the Riemann Hypothesis or Twin Prime Conjecture. But we won't explore clumpiness any further at this time.
It is darker at the top and lighter at the bottom: primes thin out as log n (Prime Number Theorem). We explore this gradual change in density.
Below, we started with a very tall 480x69120 remainder set image, primes less than 11# * 69120 = 159667200, or 8956716 primes. We chopped the very tall image horizontally into 16 pieces (each piece 480x4320), rearranged the pieces into 16 columns, scaled the image 1/8, and increased contrast (pgmnorm).

We will call the 16 columns "macro columns" to distinguish them from columns of single pixels. The boundaries between the first few macro columns are visible as the shading gets lighter. Although primes thin out, they don't thin out very quickly.
We can imagine additional macro columns going out infinitely to the right. Number all the macro columns left to right, starting from 0. Instead of using macro columns 0 through 15 as we did above, we instead pick 16 non-contiguous macro columns [0, 1, 3, 7, 15, 31,... 2^15-1] and glue them next to each other. This corresponds to a subset of the primes less than 11# * 4320 * 2^15 = 326998425600. The macro column edges become (slightly) more visible because the image covers a greater range of prime densities. (Mach banding further helps us see the boundaries.)

Previously, we considered sending these long strips of primes through a music box.
Below is an animated PNG (APNG) of primes thinning out over a large range. Each frame is approximately 1000 times further along the number line. We used apngasm to create the animation.
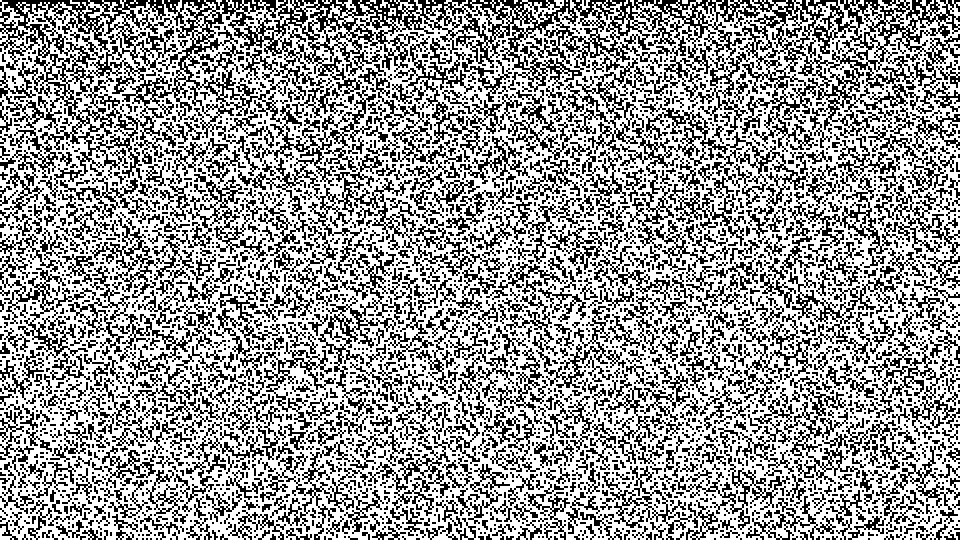
Below is the final frame of the animation, primes around 11# * 270 * (10^270 - 1). Density has thinned out considerably. There are 968 primes (black pixels) in this image. ("It's full of stars!") Contrast this with 50878 in the first frame.

In this directory are more images and Haskell source code used to generate the images.
(Update 2020-03-16: include link to image that inspired; fix formatting.)
No comments :
Post a Comment